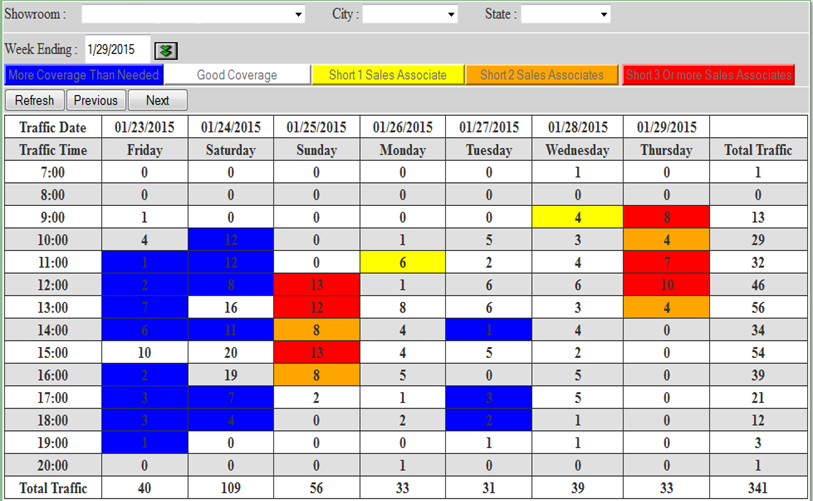
The following picture is the TRAX Hot-Zone report, and it shows you when you are over-staffing or under-staffing your showroom by the hour. Accurate counts from customer traffic allow TRAX the ability to show you weekly trends, and schedule staff for them appropriately. This graph report shows accurate traffic opportunities per hour, compared to your customizable staffing information. By moving an overstaffed hour to a red hour (as shown on your reports) can save you thousands in staffing costs, and also help you increase your sales dramatically!
TRAX is the only traffic counting company that provides 100% accurate traffic counts by allowing our customers to remove non-customer activity with our “Visual Proof” snapshot module. We work with over 4000 dealers around the world, and compare your customer traffic to your sales coverage per hour. This empowers you with the ability to react to customer trends, and rearrange the schedules at your under-performing stores appropriately, we guarantee you will experience a sustained sales increase!
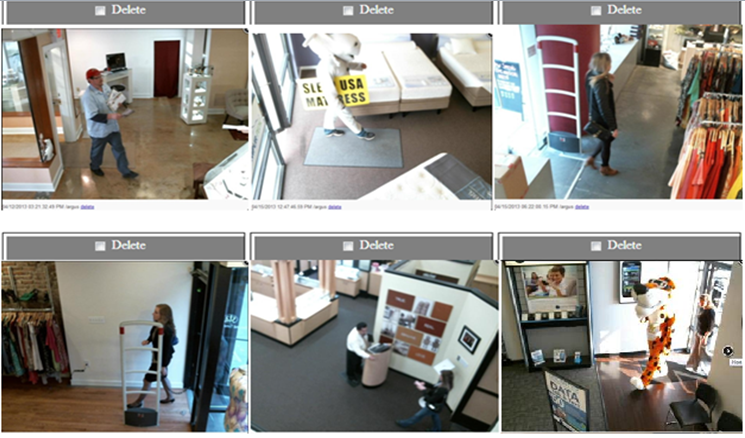
TRAX takes a snapshot of each incoming customer with a feature that allows one to remove all non-customer activity; so for the first time in retail history, one can have a 100% accurate true customer count.
TRAX also provides your accurate closing ratios along with 23 other reports that guarantee better performance on your sales floors.
Please let me know when you are available for a 15 minute introduction call from me, as I would like to speak with you further about other features available through the TRAX system that will return your future investment for as long as you use the system.

• BABTA Average Sale by Salesperson….. identifies any salesperson with an average profit that is below the company average and also identifies how much more they would earn for the company if they simply hit the average.
• BABTA Average Sales By Store…. Same as previous but totaled for each store and especially powerful when dealing with larger companies and also the corporate overview.
• BABTA Average Closing Ratio by Store….
• BABTA Average RPG by Store…. One of the most powerful reports we provide. RPG “Revenue Per Guest” is the value on every opportunity that comes into the company if they purchase or not and is the truest measure of a company’s potential. This is the report if used properly with multiple store chains where we guarantee a dramatic improvement in sales performance if used properly.
• Revenue Per Guest is a detailed analysis and comparison of Closing Ratio compared to Average Sale and also allows a dealer to create “what if” type scenarios of potential increased closing ratios or Average Sales in different markets.
• Visual Proof is where each dealer or individual showroom manager can go in a view or remove pictures of employees or for example the mail man and for the first time in retail history have an easy to monitor nearly 100% accurate customer traffic count.
• Traffic Analysis is an analysis of daily weekly, monthly, quarterly or yearly on one easy to read screen also displaying percentages of differences for each period so you can easily see immediately if as a dealer you are getting better or getting worse! This report also may be viewed by Showroom, City, State or Profit Center.
• Hourly Traffic is a weekly analysis of hourly activity with totals for each day and totals for each hour of the week.
• History Reports 4 reports that track long term history analysis of RPG, Average Profit by store, Sales Volume compared to traffic and Closing Ratio History.
• Staffing Analysis details the comparison each hour of sales coverage compared to true customer traffic patterns.
• Hot Zone Report is the comparison of employee coverage per hour to actual customer traffic on a color coded weekly report that immediately tells a dealer if they are overstaffed or understaffed at any time during the week.
• Company Sales Goals 4 reports that comprise a proprietary sales goals program that breaks down the weekly profit goals for each salesperson and insures that they are aware of their position compared to the rest of the company.
• Opportunity Comparison is a report that compares dealers who are using our CRM program to the traffic counters and is an additional tool that depicts issues with staffing in any showroom at a glance.
• Weekly Traffic Analysis is designed to compare for marketing purposes if the entire company is getting better or getting worse regarding customer traffic and allows a dealer to hold advertisers accountable for poor performance sometimes providing the dealer free make goods if the advertiser underperforms.
• Comparisons Monthly analysis of daily comparisons of traffic to last year in a bar graph format.
• Long Term Comparisons allows the dealer to easily analyze a seven year history of the entire company or any individual showroom by day, week, month, or quarter.
• Graphical Analysis provides great flexibility to analyze weekly, monthly, quarterly, yearly or select any date range and compare Number of Customers, Number of Invoices, Dollar Volume, Average Sale, Closing Ratio and Revenue Per Up