Dearest TraxSales Dealer,
There are over 60 incredible reports that are designed to help you better understand and capitalize on your business. The key reports are also so important we can automatically include them in a daily or weekly email.
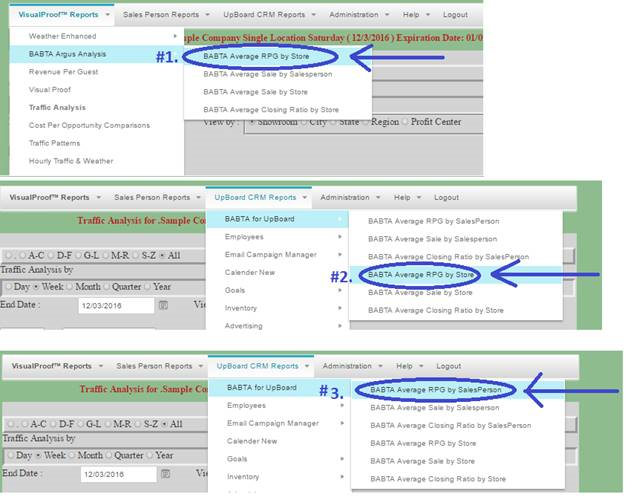
The first two key reports that I examine are BABTA RPG by Store for Visual Proof, then I compare this to BABTA RPG for UpBoard CRM. These are both at the top of each of your report columns.

There will always be a difference because the visual proof traffic counter is an unblinking eye that tracks every opportunity that comes into each showroom and the CRM Upboard report is relying on each salesperson to capture information on all of the opportunities they speak with. As you know some salespeople are better at this than others. Now with this information you will have an accurate benchmark that will give you the tools you need to maximize individual performance on each of your sales floors.
Before you can use any of this information in your company meetings you must verify that the traffic counts and the sales numbers are accurate. Do NOT proceed until you are comfortable with the data provided.
After I have determined the comparisons are accurate + or – 3-5% between the Visual Proof Traffic Counter and the CRM then I finally look at the BABTA for all sales team members. This is where the real fun begins and the opportunity for great improvement is available: as you will see.
All Three reports are set up the same way. Any store or any sales associate that is below the average RPG will be displayed on the bottom of the list with a corresponding last column total that displays the amount of lost revenue because they were below the company average for Revenue Per Guest.
Revenue Per Guest is the most powerful tool that the Trax System provides. It is the dollar value of each opportunity that visits your company if they purchase or not. This number is simply calculated by multiplying your conversion ratio by your average sale and this comparison is the mother of improvement on any sales floor.
Please notice the Store Average in the first report of $341 and the Report average #2 of $378 or a $37 difference. This is important because (hypothetically) if you were able to increase your RPG by only $37 per opportunity and your traffic stayed the same this represents an increase of $181,485 or (4905 x 37) representing a gross sales increase of over 10%. Again, this is with the same traffic and I am going to prove that this increase is very possible by focusing on the bottom 20% of performance in your company.
|
Traffic Counter RPG Analysis by Store for Test Dealer From Sunday ( 12/01/2016 ) To Monday ( 12/31/2016 ) |
|||||||||||||||||||||||||||||||||||||||||||||||||||||||
|
|
CRM UpBoard RPG Analysis by Store for Test Dealer From Sunday ( 12/01/2016 ) To Monday ( 12/31/2016 ) |
||||||||||||||||||||||||||||||||||||||||||||||||||||||||||||
|
|
RPG Analysis by Salesperson for Test Dealer From Sunday ( 12/01/2016 ) To Monday ( 12/31/2016 ) |
||||||||||||||||||||||||||||||||||||||||||||||||||||||||||||||||||||||||||||||||||||||||||||||||||||||||||||||||||||||||||||||||||||||||||||||||||||||||||||||||||||||||||||||||||||||||||||||||||||||||||||||||||||||||||||||||||||||||||||||||||||||||||||||||||||||||||||||||||||||||||||||||||||||||||||||||||||||||||||||||||||||||||||||||||||||||||||||||||||||||||||||||||||
|
The next step is to analyze the last report and focus on the bottom 20% or the sales team members who have the highest potential increase in dollar volume.
Please not the last 2 sales associates Denise and Jourdan. As you can see both of these salespeople are about $250 lower in the average sale department and both of their respective closing ratios are about 7% lower than the average. Please keep in mind; we are not comparing them to the top performers like Natalie or Taylor (that is an entirely different opportunity). We are comparing them to the averages and half the company is already there so even they will readily agree that it’s doable with training and passion!
|
Youngstown |
Denise |
$46,586 |
44.5 |
199.5 |
$1,047 |
22.31% |
$234 |
$378 |
-38% |
$75,378 |
$28,792 |
|
Breckenridge |
Jourdan |
$43,984 |
41.0 |
190.0 |
$1,073 |
21.58% |
$232 |
$378 |
-39% |
$71,786 |
$27,802 |
If you have any questions please do not hesitate to call my private cell anytime. 713.854.7706 I would love to hear from you!
Better yet please hit reply and let us know how we are doing. We would love your feedback and comments.
Regards,
Dave Mink, President

